
Recurring Revenue vs. Project Revenue: How Buyer Perception Changes the Math
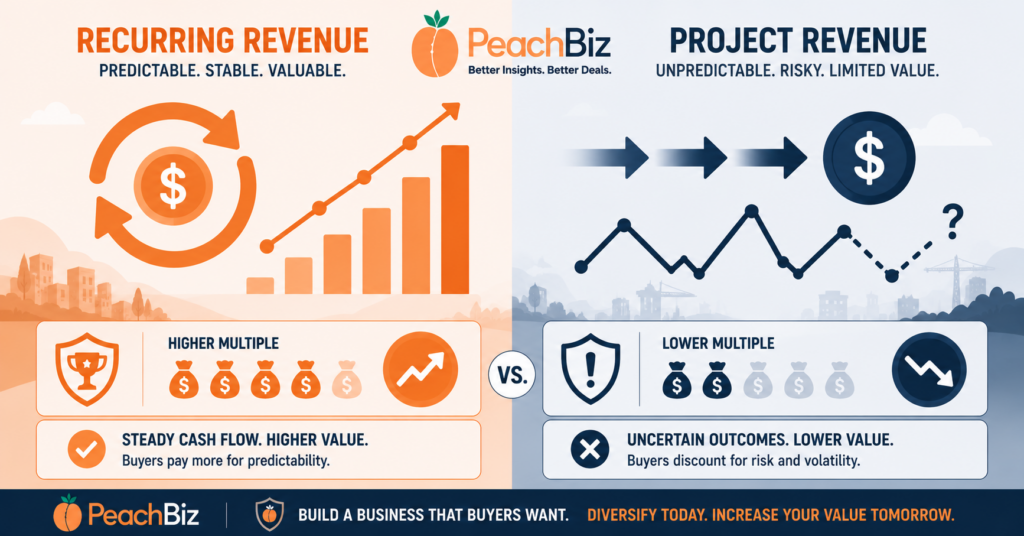
Two businesses. Same industry. Same revenue. Same EBITDA. Same owner. Same market.
One sells for $2,400,000. The other sells for $1,600,000.
What’s the difference? One has 60% recurring revenue. The other earns everything from one-time projects.
That $800,000 gap — on identical earnings — is the recurring revenue premium. And it’s one of the most consistent, well-documented patterns in business sale data across virtually every industry and deal size.
Most business owners understand intuitively that recurring revenue is good. What they don’t understand is precisely why buyers pay so much more for it, exactly how the premium is calculated, and — most practically — what they can actually do to build more recurring revenue into their business before going to market.
This article answers all three questions. By the end, you’ll understand the math behind the premium, know how buyers specifically model recurring versus project revenue, and have a concrete strategy for converting more of your revenue into the kind that commands a premium at sale.
Why Buyers Pay More for Recurring Revenue: The Actual Logic
The premium buyers pay for recurring revenue isn’t irrational or arbitrary. It’s a precise reflection of the difference in risk between two fundamentally different revenue models.
To understand it, think about what a buyer is actually underwriting when they evaluate your business.
The project revenue underwriting problem:
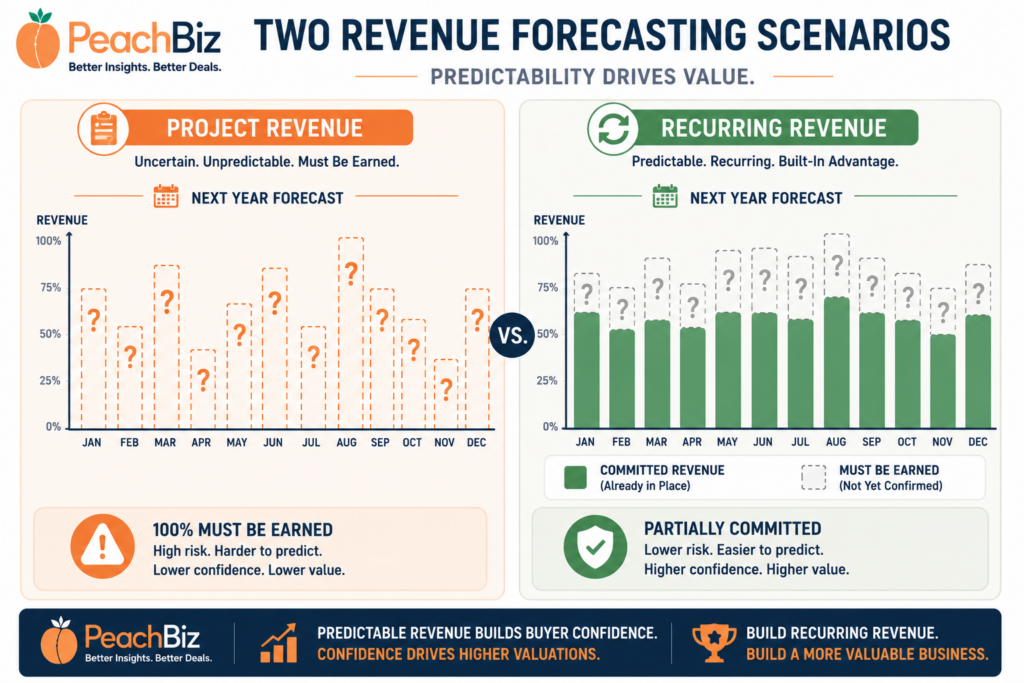
A business that earns $600,000 in annual revenue through projects starts each year at $0 in committed revenue. Every dollar of next year’s revenue has to be sold, won, scoped, delivered, and invoiced from scratch. The buyer’s confidence that those $600,000 in projects will materialize next year is based entirely on historical pattern — and historical patterns don’t guarantee future results.
The buyer is essentially making a bet: “I believe this business can generate $600,000 in projects next year because it has done so in the past.” That’s a reasonable bet, but it’s still a bet. And bets require compensation for risk — which shows up as a lower multiple.
The recurring revenue underwriting advantage:
A business that earns $600,000 in annual revenue with 60% recurring ($360,000) starts each year with $360,000 already committed. Before the owner has made a single sales call, attended a single meeting, or delivered a single project, more than half of next year’s revenue is already on the books.
The buyer’s underwriting confidence is dramatically higher. They’re not betting on whether the revenue will materialize — a significant portion of it is contractually committed. The risk they’re pricing is much smaller. And smaller risk means a higher multiple.
The Math of the Premium
Let’s put specific numbers to the premium so you understand exactly what’s at stake.
In most industries, the difference in multiple between a high-recurring and low-recurring business is 1.0x–2.0x SDE or EBITDA. Here’s what that looks like in practice across a few sectors:
Home Services (HVAC, Pest Control, Landscaping)
| Recurring Revenue % | Typical SDE Multiple Range |
|---|---|
| Under 20% (project/seasonal only) | 2.0x – 3.0x |
| 20–40% (some service contracts) | 3.0x – 4.0x |
| 40–60% (significant contract base) | 4.0x – 5.0x |
| 60%+ (contract-dominant) | 5.0x – 6.5x |
IT / Managed Services (MSP)
| Recurring Revenue % | Typical SDE/EBITDA Multiple Range |
|---|---|
| Under 30% (project-heavy) | 3.0x – 4.0x |
| 30–50% (mixed) | 4.0x – 5.5x |
| 50–70% (MRR-focused) | 5.5x – 7.0x |
| 70%+ (MRR-dominant) | 7.0x – 10.0x+ |
Professional Services (Accounting, Marketing, Consulting)
| Recurring Revenue % | Typical SDE Multiple Range |
|---|---|
| Under 20% (project billing) | 2.0x – 3.0x |
| 20–40% (some retainers) | 3.0x – 4.0x |
| 40–60% (retainer-significant) | 4.0x – 5.0x |
| 60%+ (retainer-dominant) | 5.0x – 6.0x+ |
E-Commerce / Subscription
| Revenue Model | Typical Multiple Range |
|---|---|
| Purely transactional (no subscriptions) | 2.5x – 3.5x SDE |
| Subscription component (20–40%) | 3.5x – 5.0x SDE |
| Subscription-dominant (60%+) | 5.0x – 8.0x SDE |
| Pure subscription (SaaS-like) | 8.0x – 15.0x+ Revenue |
The pattern is consistent: in every industry, higher recurring revenue percentages command materially higher multiples. And the relationship is not linear — the biggest multiple jumps happen as you cross certain thresholds (particularly the 40% and 60% marks in most industries).
How Buyers Model Recurring vs. Project Revenue
Understanding the premium is one thing. Understanding exactly how buyers think about it — the mental model they’re using when they evaluate your revenue mix — helps you present your business more effectively and negotiate from a more informed position.
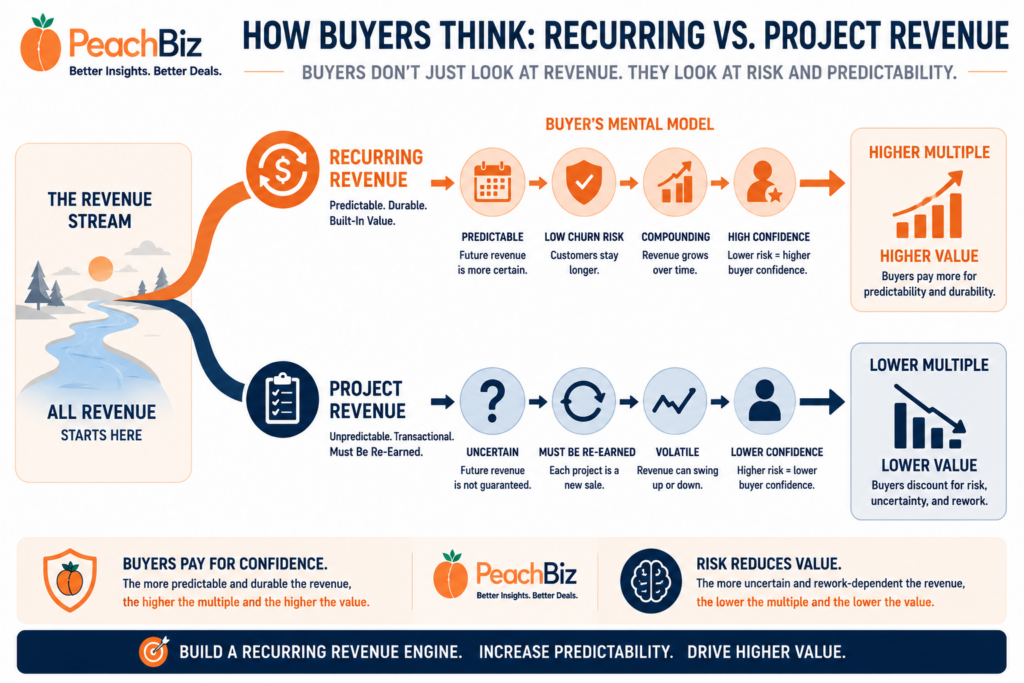
Buyers mentally split your revenue into two buckets:
When a buyer evaluates your financials, they don’t just look at your total revenue number. They mentally split your revenue into two buckets — recurring and non-recurring — and value each differently.
Recurring revenue is valued at a premium multiple because it’s predictable and because it represents future cash flows the buyer can count on. Non-recurring revenue is valued at a lower multiple because it has to be re-earned and because its continuation is less certain.
The weighted average multiple:
Sophisticated buyers — and their financial models — often apply a blended multiple that weights recurring and non-recurring revenue differently. A simplified version of this calculation:
Business with $600,000 EBITDA:
- 60% recurring ($360,000) × 5.5x multiple = $1,980,000
- 40% project ($240,000) × 3.5x multiple = $840,000
- Total implied value: $2,820,000 (blended ~4.7x)
Same business if revenue were 100% project:
- $600,000 × 3.5x = $2,100,000
Same business if revenue were 80% recurring:
- 80% recurring ($480,000) × 6.0x = $2,880,000
- 20% project ($120,000) × 3.5x = $420,000
- Total implied value: $3,300,000 (blended ~5.5x)
The difference between 40% and 80% recurring, on the same total earnings, is $480,000 in enterprise value. That’s the math that makes recurring revenue the highest-ROI value driver for most businesses.
Net Revenue Retention — the metric buyers love:
For businesses with a significant recurring revenue base, buyers also look at Net Revenue Retention (NRR) — the percentage of recurring revenue that renews from one period to the next, accounting for churn, downgrades, and expansions.
- NRR above 100%: Existing customers are not just staying — they’re spending more. This is the best possible recurring revenue signal.
- NRR 90–100%: Strong retention with modest churn. Healthy and attractive to buyers.
- NRR 80–90%: Acceptable but signals some churn issue worth investigating.
- NRR below 80%: Meaningful churn that may partially offset the recurring revenue premium.
If you have a recurring revenue base, know your NRR before buyers ask. It’s one of the first metrics a sophisticated buyer or their advisor will calculate from your customer-level revenue data.
How to Calculate Your Recurring Revenue Percentage
Before you can improve your recurring revenue mix, you need to know where you actually stand. Here’s how to calculate it accurately.
Step 1: Define what counts as recurring in your business.
Not all repeat revenue is recurring revenue. The distinction is contractual or structural commitment — revenue that renews without requiring a new purchase decision.
Recurring revenue includes:
- Monthly or annual service contracts with auto-renewal provisions
- Subscription fees (software, memberships, access fees)
- Retainer agreements where the client pays a fixed monthly fee
- Maintenance contracts that renew on a schedule
- Warranty or service plan fees
- Auto-replenishment orders where the customer has set up recurring delivery
Does NOT count as recurring:
- Repeat customers who buy regularly but without a contractual commitment
- Annual project clients who have historically come back each year but aren’t contracted
- Customers who have been with you for years but could leave without notice or penalty
This distinction matters because buyers will apply it themselves. If you claim a customer is “recurring” because they’ve ordered every month for three years but have no contract, a buyer’s advisor will correctly categorize that as a repeat transactional customer — not recurring. Count only what’s genuinely committed.
Step 2: Pull your trailing 12-month revenue by customer and revenue type.
For each revenue line item in your trailing 12 months, categorize it as recurring or non-recurring. Sum each category.
Step 3: Calculate the percentage.
Recurring Revenue % = Total Recurring Revenue ÷ Total Revenue × 100
Do this for each of the past three years. You want to see the trend — is your recurring percentage growing, stable, or shrinking? A growing recurring percentage is a positive signal buyers will notice.
Step 4: Calculate your NRR if you have meaningful recurring revenue.
NRR = (Beginning Recurring Revenue + Expansion Revenue − Churned Revenue) ÷ Beginning Recurring Revenue × 100
If you don’t track this at the customer level, build it retroactively from your customer data for the past two years. The exercise of building it often surfaces insights about which customers are growing, which are churning, and where your retention risks actually live.
The Recurring Revenue Conversion Playbook
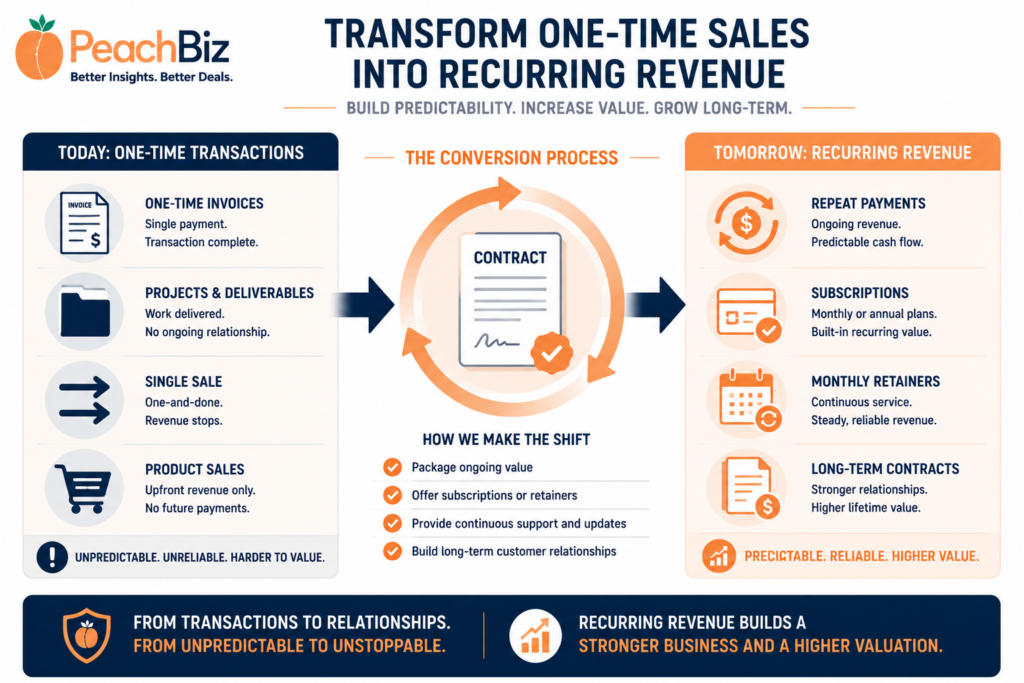
Here’s the practical strategy for increasing your recurring revenue percentage — organized by business type and timeline.
Service Businesses (Trades, Home Services, Cleaning, Landscaping)
The most natural recurring revenue structure for service businesses is the maintenance or service contract — an annual agreement where the customer pays for scheduled service delivery on a regular cadence.
Implementation approach:
- Design a tiered maintenance plan (Basic, Standard, Premium) with clear deliverables at each tier
- Price it to be slightly better value than paying per-visit — enough that customers see the benefit, not so deep that you erode margins
- Lead with the annual contract in every new customer conversation — make it the default, not the upsell
- For existing customers, convert at renewal or at the next major service event with a clear value proposition
- Automate renewal — credit card on file, auto-renewal default, opt-out rather than opt-in
A pest control company that converts 60% of its customer base to quarterly service contracts fundamentally changes its risk profile. An HVAC company with annual maintenance contracts for 500 customers has a recurring revenue base that a buyer can model with confidence.
Professional Services (Accounting, Marketing, Legal, Consulting)
Professional services businesses are naturally project-driven — clients come with a specific need, you deliver, they pay. Converting this to recurring requires changing both the pricing model and the service delivery structure.
Implementation approach:
- Monthly retainers: Package your most commonly needed services into a monthly retainer that clients pay on the first of each month. The retainer covers a defined scope of ongoing work. Anything outside that scope is billed additionally.
- Annual service agreements: For clients who don’t fit a monthly retainer model, annual agreements with quarterly billing create a middle ground — not monthly recurring, but contracted annual revenue.
- Value-based pricing: The most successful retainer conversions reframe the client relationship from “we bill for time” to “we deliver outcomes for a fixed monthly fee.” This shifts the conversation from hours to results, which makes the retainer easier for clients to justify and more profitable for you to deliver.
The accounting firm that converts its top 20 clients from annual tax engagements to monthly bookkeeping and advisory retainers doesn’t just increase its revenue predictability — it typically increases its revenue per client and its client retention simultaneously.
E-Commerce and Product Businesses
Product businesses have the broadest range of recurring revenue structures available, from the very simple to the sophisticated.
Implementation approaches by complexity:
- Auto-replenishment: For consumable products, offer a subscription option where customers receive automatic shipment on a schedule they set. Incentivize with a 10–15% discount and free shipping. This is the lowest-friction recurring revenue model for most product businesses.
- Subscription boxes: Curated monthly or quarterly collections create recurring revenue with a discovery element that customers actively look forward to. Higher margin than auto-replenishment in many categories.
- Membership programs: Annual or monthly memberships that provide benefits (early access, exclusive pricing, free shipping, priority service) convert transactional customers into recurring members.
- B2B supply agreements: For product businesses with a commercial customer base, supply agreements with committed order quantities and pricing are the professional services equivalent of a retainer.
IT and Technology Businesses
IT businesses — particularly managed service providers — are the clearest example of the recurring revenue premium in action. The market’s preference for MRR-based IT businesses over project-based ones is so strong that it has fundamentally reshaped how the industry operates over the past decade.
If you run an IT business that’s still primarily project-based, the path to a significantly higher valuation is clear: convert to a managed services model with Monthly Recurring Revenue (MRR) as your primary revenue engine.
The conversion framework:
- Package your most commonly needed IT services (monitoring, patching, helpdesk, security, backup) into tiered managed services plans
- Price per device or per user per month — predictable for both you and the client
- Transition existing project clients to managed services contracts at their next major project or renewal point
- Position new client acquisitions as managed services relationships from day one
An IT business at 30% MRR trading at 4x can become a business at 65% MRR trading at 7x — on the same underlying earnings — through a 24–36 month managed services conversion. That’s the kind of multiple expansion that makes the conversion investment clearly worthwhile.
Presenting Your Recurring Revenue to Buyers
Once you’ve built or improved your recurring revenue base, presenting it effectively is as important as having it.
In your CIM:
- Lead with your recurring revenue percentage prominently — it’s one of the first things sophisticated buyers look for
- Show the three-year trend in recurring revenue percentage — growth from 25% to 45% over three years is a powerful positive signal
- Break down recurring revenue by type (maintenance contracts, retainers, subscriptions) so buyers understand what’s driving it
- Include your NRR if it’s strong (90%+) — it validates that your recurring base is stable, not churning
In your financial presentation:
- Present recurring revenue separately from non-recurring revenue in your monthly P&L summary
- Show the average length of customer relationship for your recurring customer base — tenure validates stability
- Provide a renewal schedule showing when major contracts or subscriptions come up for renewal and your historical renewal rates
In buyer conversations:
- Be specific about what makes your recurring revenue contractual — the term lengths, the auto-renewal provisions, the notice periods required to cancel
- Anticipate the NRR question and have your calculation ready
- Be ready to walk through your largest recurring relationships — who they are, how long they’ve been with you, what they pay, and what your relationship with them looks like
👉 Use our free Business Valuation Calculator to see how your current recurring revenue percentage affects your valuation — and model what a higher percentage would do to your multiple.
👉 Run our EBITDA Growth Calculator to see how converting project revenue to recurring structures — which often increases margins as well — compounds with a higher multiple to dramatically expand enterprise value.
Frequently Asked Questions
How quickly can I build meaningful recurring revenue?
It depends on your business model and starting point. Service contract programs can be launched and begin generating signed contracts within 90 days. Converting existing customers to retainers typically takes 6–12 months to move a significant percentage of your base. Building a meaningful recurring revenue track record — three years of stable or growing recurring percentages that show up in your financial history — takes 24–36 months. Start now regardless of your timeline — even a year of improving recurring percentage is better than none.
Do buyers discount recurring revenue if the contracts are short-term?
Yes — the term length of your recurring contracts affects how buyers value them. Month-to-month recurring agreements are better than no recurring revenue, but they’re discounted relative to annual or multi-year contracts because a customer can exit without penalty on 30 days’ notice. Annual contracts with auto-renewal are the minimum that buyers treat as genuinely recurring. Multi-year contracts are the gold standard. When building recurring structures, push for annual or multi-year terms wherever your customer relationships will support it.
What if my customers resist converting to contracts?
Customer resistance to contracts is real and understandable — they’re accustomed to flexibility. The conversion strategy that works best is making the contract clearly beneficial to the customer: better pricing, priority service, guaranteed response times, annual reviews. Make the contract the better option, not just a more restrictive one. For customers who genuinely won’t convert, accept that and focus your conversion energy on new customers — who can be acquired under a recurring model from day one.
Is recurring revenue less valuable if it comes from a few large customers?
Yes — recurring revenue and customer concentration are both factors in the buyer’s assessment, and they interact. Highly concentrated recurring revenue (three customers under contract representing 70% of your revenue) is better than highly concentrated project revenue — but it’s still worse than diversified recurring revenue. Buyers apply a blended assessment. High recurring percentage plus high diversification is the premium combination.
Does recurring revenue affect the type of buyers I attract?
Significantly. High-recurring businesses attract a broader buyer pool — including private equity, strategic acquirers, and sophisticated individual buyers who specifically target recurring revenue models. These buyers typically pay higher multiples and are better capitalized than purely transactional business buyers. In some sectors (IT/MSP, home services, professional services), PE roll-up buyers specifically target recurring revenue businesses and will compete aggressively for ones with strong MRR or contract bases.
The Bottom Line
The difference between recurring revenue and project revenue isn’t just a revenue model preference. It’s a fundamental difference in how buyers perceive risk, how they model future cash flows, and ultimately how much they’re willing to pay.
The math is clear. The premium is real and measurable. And unlike most valuation factors — which are influenced by market conditions, industry trends, and factors outside your control — your recurring revenue percentage is something you can deliberately build.
Every service contract signed, every retainer converted, every subscription launched is a direct investment in your future exit multiple. The returns compound — both in the annual multiple premium and in the growing base of predictable revenue it creates.
Start building it now. Your future multiple depends on what your recurring revenue percentage looks like three years from today.
👉 See what your recurring revenue percentage is currently doing to your valuation with our free Business Valuation Calculator.
Related Reading
- The 7 Value Drivers That Push Your Multiple Above the Midpoint
- EBITDA Multiples by Industry: What Buyers Are Actually Paying Right Now
- Owner Dependency: The Single Biggest Value Killer in Small Business Sales
- How Customer Concentration Tanks a Valuation (And How to Fix It Before You Sell)
- What Is a Business Worth? The 4 Valuation Methods Explained
- The 10 Factors Buyers Score Before They Make an Offer
- Explore All Free PeachBiz Business Calculators