Wide-format flat-design illustration of a business exit roadmap as a winding road passing through six milestone markers — understand your value, assess exit readiness, clean up financials, build value drivers, structure the deal, and advisor strategy — with a business owner figure at the start and a closing handshake at the end, in a warm peach-orange and dark navy palette.

The Complete Guide to Business Exit Readiness & Valuation

Selling a business is the most significant financial transaction most owners will ever make. The proceeds fund retirement, family legacy, the next venture, or simply the freedom to do something different. And yet most business owners spend more time planning a vacation than planning their exit. The result is predictable: businesses that sit on the […]

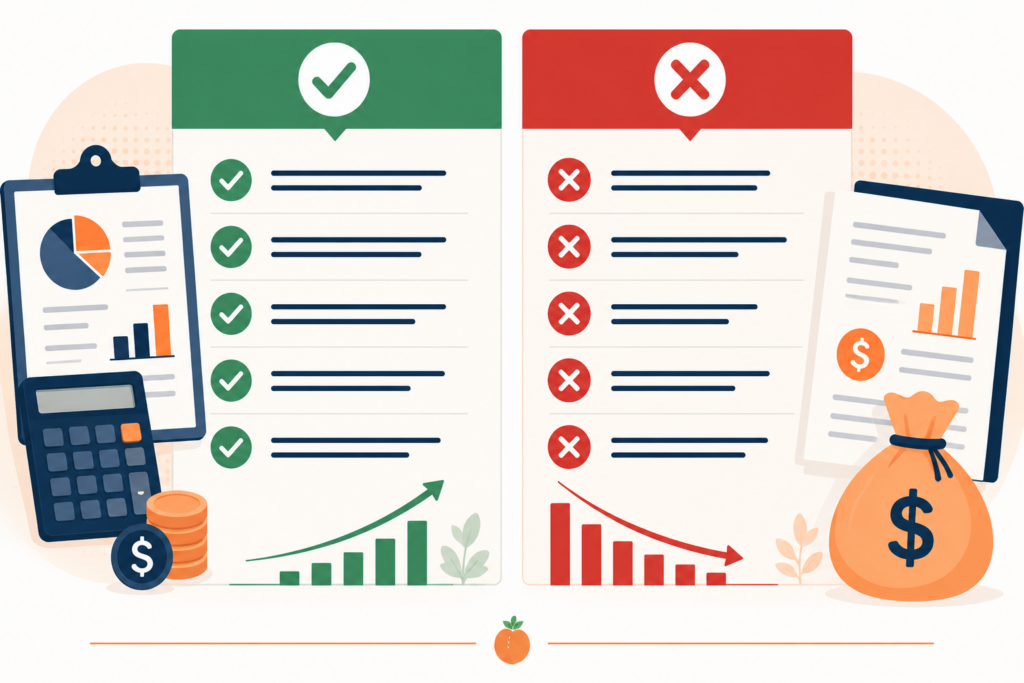
Wide-format flat-design two-column illustration with a green checkmark header and list on the left representing accepted EBITDA add-backs, and a red X header and list on the right representing rejected add-backs, with financial document and calculator icons nearby, in a warm peach-orange and dark navy palette.

The EBITDA Add-Backs Buyers Accept vs. The Ones That Blow Up Deals

Add-backs are one of the most powerful tools in a business seller’s arsenal — and one of the most abused. Done right, a properly documented add-back schedule can legitimately increase your normalized earnings by 20, 30, sometimes 50 percent above what your tax return shows. That translates directly into a higher valuation and more money […]

Wide-format flat-design illustration of a Seller's Discretionary Earnings Statement on a desk with rows of unreadable financial line items, supporting tax returns, bank statements, and receipts stacked beside it, plus a calculator and pen, in a warm peach-orange and dark navy palette.

How to Build a Seller’s Discretionary Earnings (SDE) Statement That Holds Up Under Due Diligence

Your SDE statement is the most important financial document in your business sale. Not your tax return. Not your profit and loss statement. Not your balance sheet. Your SDE statement. It is the document that tells buyers, their lenders, and their advisors what your business actually earns — stripped of tax strategy, personal expenses, and […]

Wide-format flat-design illustration of a buyer at a desk with three financial document stacks labeled Year 1, Year 2, and Year 3, holding a magnifying glass over one document with green highlight marks on some sections and red question marks on others, in a warm peach-orange and dark navy palette.

3 Years of Financials: What Buyers Read, What They Ignore, and What Scares Them

When a qualified buyer sits down with your three years of financials, they are not reading them the way your accountant reads them. They are not reading them the way you read them. They are reading them like a detective. They’re not looking for what’s there. They’re looking for what’s missing, what doesn’t reconcile, what […]

Wide-format flat-design illustration of a balanced scale with a stack of clean, organized financial documents and a green checkmark on the left tipping it heavier, and a large percentage symbol representing a valuation multiple on the right, with a rising bar chart in the background, in a warm peach-orange and dark navy palette.

Why Clean Books Are Worth More Than a Higher Multiple

Ask most business owners what they want to improve before selling, and they’ll tell you they want a higher multiple. It makes sense on the surface. If your business earns $400,000 in SDE and you can get a 3.5x multiple instead of a 3.0x, that’s $200,000 more in your pocket. Who wouldn’t want that? The […]

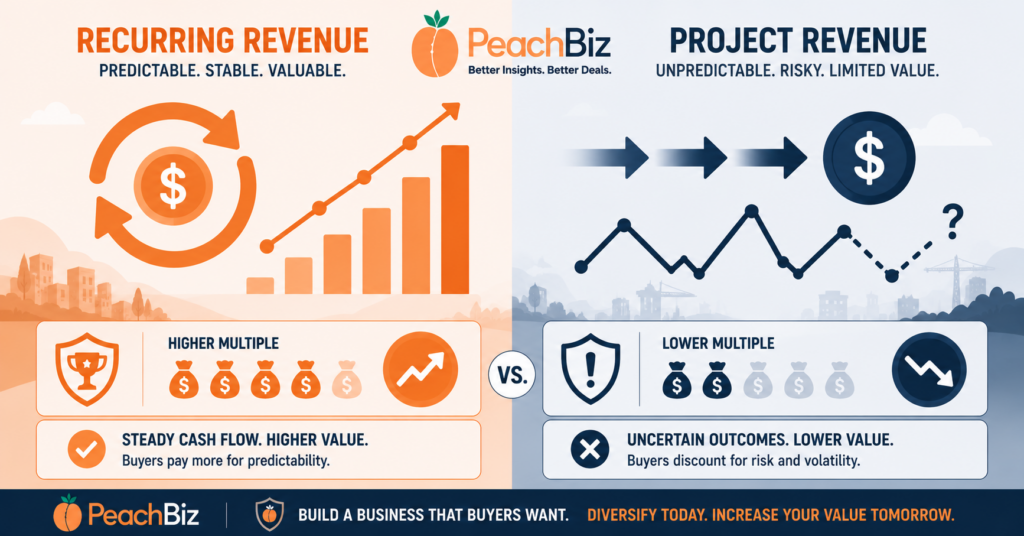
Wide-format flat-design illustration split into two halves — a recurring revenue side with circular repeat-payment arrows, a steady upward trend line, and a higher multiple indicator, and a project revenue side with one-directional arrows, a jagged uncertain revenue line, and a lower multiple indicator — in warm peach-orange for recurring and dark navy for project revenue.

Recurring Revenue vs. Project Revenue: How Buyer Perception Changes the Math

Two businesses. Same industry. Same revenue. Same EBITDA. Same owner. Same market. One sells for $2,400,000. The other sells for $1,600,000. What’s the difference? One has 60% recurring revenue. The other earns everything from one-time projects. That $800,000 gap — on identical earnings — is the recurring revenue premium. And it’s one of the most […]

Let's get started

Give us a call or fill in the form below and we will contact you. We endeavor to answer all inquiries within 24 hours.