
EBITDA Multiples by Industry: What Buyers Are Actually Paying Right Now
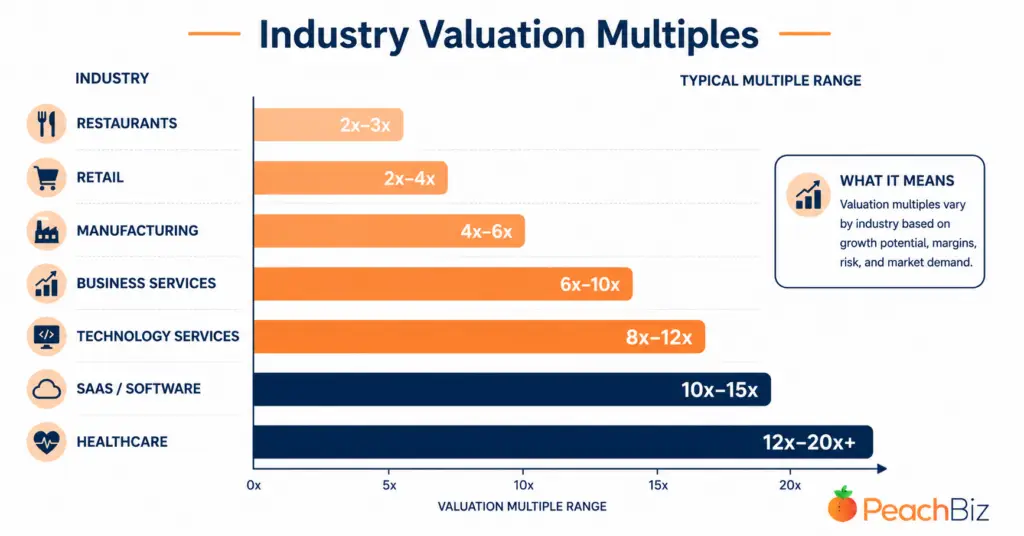
If you’ve ever Googled “what multiple is my business worth,” you’ve probably seen some version of this: a generic table with a column of industries and a column of numbers. And you’ve probably wondered — is any of this real? Where does it come from? And does it actually apply to your business?
Fair questions. The honest answer is that multiples are real, they do matter enormously, and the published ranges are a legitimate starting point. But they’re also one of the most misunderstood metrics in the business sale process — and applying them without context can set you up for a frustrating, even failed, transaction.
In this article, we’re giving you the most current industry-by-industry multiple data available, sourced from actual closed transactions. We’re also going to explain what those numbers actually mean, why two businesses in the same industry can have wildly different multiples, and what you can do right now to move your business toward the top of its range.
Let’s get into it.
First: SDE Multiples vs. EBITDA Multiples — Which One Applies to You?
Before we get to the data table, there’s one thing you need to understand: the metric used to calculate your multiple depends on the size of your business. Using the wrong one produces a number that’s either too high or too low — and that causes real problems in a transaction.
Here’s how it breaks down:
SDE (Seller’s Discretionary Earnings) multiples apply to most small, owner-operated businesses — generally those with under $1M–$2M in total earnings. SDE adds back the owner’s salary, personal benefits, and one-time expenses to get a clean picture of what the business puts in the owner’s pocket. Buyers of these businesses are typically individuals, self-funded searchers, or SBA borrowers who plan to replace the owner. They’re buying a job plus a return — so SDE is the right lens.
EBITDA multiples take over as businesses grow and a professional management team replaces the owner’s day-to-day role. Once a business generates $1M–$2M+ in earnings, institutional buyers, private equity firms, and strategic acquirers enter the picture. These buyers use EBITDA because it lets them compare operating performance across different capital structures.
The practical rule of thumb:
- Under $2M in enterprise value → value on SDE
- $2M–$10M in enterprise value → transition zone, often both metrics used
- $10M+ → value on EBITDA
The BizBuySell average cash flow multiple moved from 2.57x in 2024 to 2.61x in 2025 to 2.7x in Q1 2026, showing modest but steady improvement on the Main Street side. According to the IBBA and M&A Source Market Pulse Report, the median SDE multiple for Main Street businesses (under $2M in value) was 2.86x in Q4 2025, while lower mid-market transactions ($2M–$50M) saw median EBITDA multiples of 4.8x.
Now let’s look at where your industry falls.
2026 SDE & EBITDA Multiples by Industry
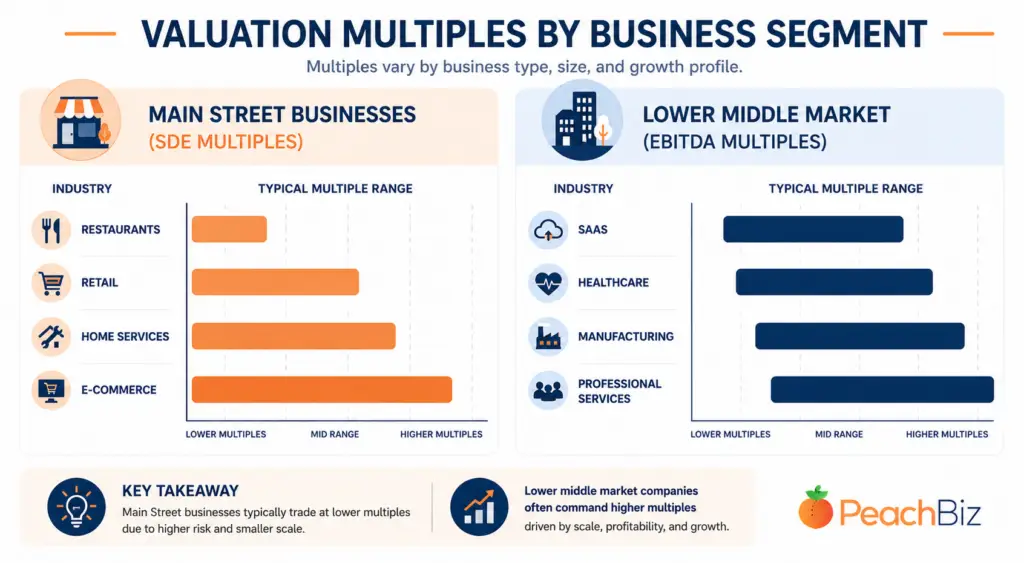
The ranges below reflect 2025–2026 closed transaction data from BizBuySell, the IBBA Market Pulse, GF Data, and lower middle-market M&A advisory experience. SDE multiples apply to smaller owner-operated businesses; EBITDA multiples apply to larger businesses with professional management.
Important: These are ranges, not fixed points. Every business falls somewhere inside its industry band based on quality factors covered in the next section.
Main Street Businesses (SDE Multiples)
| Industry | SDE Multiple Range | Notes |
|---|---|---|
| Restaurants | 1.5x – 3.0x | Low end for single location; higher for multi-unit with systems |
| Retail (brick & mortar) | 1.5x – 2.8x | E-commerce component improves multiple |
| E-commerce / Online Retail | 2.5x – 4.0x | Recurring customers and brand strength push higher |
| Landscaping / Lawn Care | 2.0x – 3.0x | Recurring seasonal contracts lift multiple significantly |
| HVAC | 3.0x – 5.0x | Among the highest in trades; recurring service contracts drive premium |
| Plumbing | 2.5x – 4.5x | Commercial + maintenance mix commands higher end |
| Electrical | 2.5x – 4.0x | Commercial focus and backlog strength matter |
| Roofing | 1.5x – 3.0x | Project-based model depresses multiples; maintenance contracts help |
| Pest Control | 3.0x – 5.0x | Quarterly recurring revenue; active PE buyer pool |
| Car Washes | 4.0x – 5.5x | High recurring, low labor; asset value also a factor |
| Laundromats | 3.5x – 4.5x | Asset-based + recurring; strong investor demand |
| Auto Repair | 2.0x – 3.5x | Multi-location with systems commands higher end |
| Childcare / Daycare | 2.5x – 4.0x | Licensing creates barrier to entry; waitlists help |
| Dog Daycare / Boarding | 3.5x – 4.5x | High recurring, fragmented market, PE interest growing |
| Insurance Agencies | 3.0x – 5.0x | Book of business value; high recurring commissions |
| Accounting / Bookkeeping | 2.5x – 4.0x | Client retention rate is the key driver |
| Dental Practices | 3.5x – 5.0x | DSO rollup demand sustains premium pricing |
| Medical / Veterinary | 3.0x – 5.0x | Specialty mix and recurring patient base key |
| IT / Managed Services (MSP) | 3.0x – 5.0x | MRR percentage is the dominant driver |
| Marketing Agencies | 2.0x – 3.5x | Retainer revenue vs. project revenue splits range |
| Staffing Firms | 2.0x – 3.5x | Skilled trade/healthcare staffing commands higher end |
| Funeral Homes | 4.0x – 5.0x | High barriers to entry; preneed contracts add value |
| Storage Facilities | 4.0x – 5.5x | Asset value plus recurring occupancy income |
Lower Middle Market (EBITDA Multiples — $1M+ EBITDA)
| Industry | EBITDA Multiple Range | Notes |
|---|---|---|
| SaaS / Software (Subscription) | 8.0x – 15.0x | NRR and growth rate are primary drivers |
| Software (Non-SaaS) | 6.0x – 9.0x | Recurring support contracts help; project-based depresses |
| Technology Services | 6.0x – 8.0x | MSP at scale; contract duration matters |
| Healthcare Services | 5.0x – 9.0x | Specialty, payor mix, and PE rollup activity drive range |
| Business Services | 5.0x – 8.0x | GF Data reported 7.4x average in 2025 — record high |
| Manufacturing | 5.0x – 7.0x | Niche product, proprietary process, or defense work lifts multiple |
| Distribution / Logistics | 5.0x – 7.0x | Exclusive distribution agreements and recurring contracts matter |
| Professional Services | 4.0x – 7.0x | Owner-client dependence is the primary downside risk |
| Construction (Specialty) | 4.0x – 6.0x | Backlog, bonding capacity, and recurring clients drive higher end |
| Home Services (Platform) | 4.0x – 6.0x | PE platform deals at scale; recurring service mix critical |
| Food & Beverage | 4.0x – 6.0x | Brand strength and distribution reach matter most |
| E-commerce (Scale) | 3.0x – 6.0x | DTC brand vs. marketplace dependency splits range significantly |
Why Two Businesses in the Same Industry Get Completely Different Multiples
This is the part most people skip over — and it’s the part that costs them the most money.
The industry gives you a band. Where your business lands inside that band is determined by your specific profile. A best-in-class home services business can hit 6x; a weak one struggles to clear 3x. Same industry, double the multiple.
Here are the six factors that move you inside your range:
1. Recurring Revenue Percentage
This is the single biggest multiple lever in any industry. A pest control or HVAC service business with 60% recurring contracts trades 1–2 turns higher than the same business at 15% recurring. If you have monthly retainers, service contracts, subscriptions, or any form of automatic renewal revenue — buyers pay more for it, and they pay more for it across every industry.
2. Owner Dependence
If the business needs you to function, buyers discount it. Heavily. The question every buyer’s advisor asks is: “What happens to revenue if the owner leaves on day 31?” If the answer involves significant risk, the multiple shrinks to account for that risk. Reducing your operational role before going to market is one of the highest-ROI things you can do to improve your valuation.
3. Customer Concentration
Businesses where no single customer represents more than 10% of revenue, and the top 10 customers account for less than 40% of revenue, trade at significantly higher multiples. Businesses with customer concentration below 20% (top 3 customers) receive offers 30–45% higher than peers with concentration above 50%.
If one customer accounts for 30% or more of your revenue, expect that to be the first thing a buyer’s advisor flags — and expect it to compress your multiple.
4. Size Premium
A $2M EBITDA staffing company sells at 4x–5x. The same business at $15M EBITDA sells at 8x–10x. The multiple nearly doubles. This is one of the most powerful — and underappreciated — dynamics in business valuation. Growing your earnings isn’t just additive in value; it’s multiplicative. More earnings plus a higher multiple equals exponentially more enterprise value.
5. Financial Documentation Quality
Businesses without clean, auditable financials often receive offers 30–50% below asking price, with the discount reflecting both risk and the cost of reconstructing accurate records. Buyers can’t pay for earnings they can’t verify. Three years of clean tax returns, normalized financials, and documented add-backs aren’t just nice to have — they’re a prerequisite for getting a premium offer.
6. Growth Trajectory
A business growing 15% year-over-year gets valued differently than one that’s flat or declining — even at the same EBITDA level. Buyers are buying the future, not the past. If your trend line points up, it’s worth showing that clearly in your financials and your marketing materials.
What the 2026 Market Is Actually Telling Us
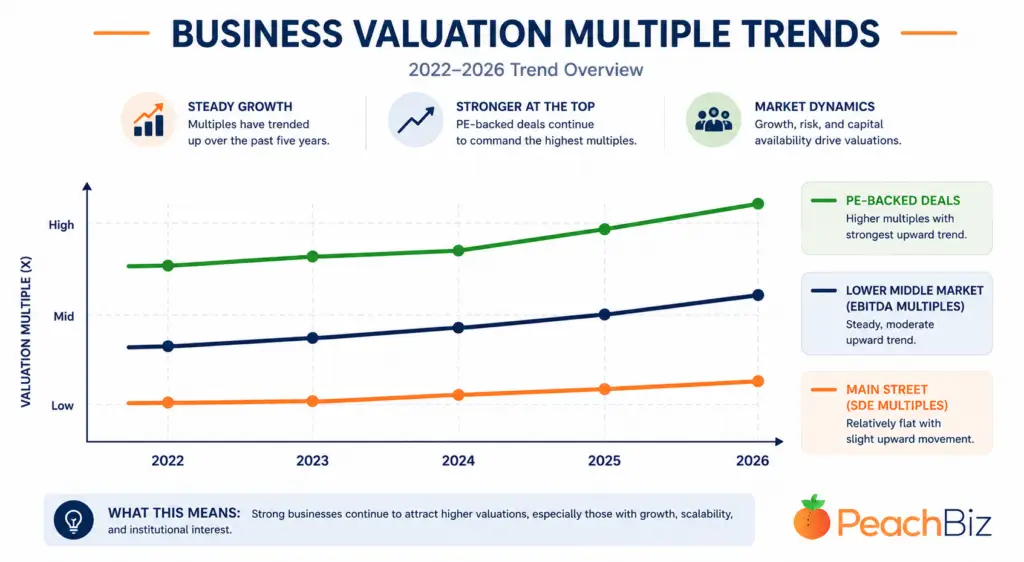
Here’s what the current transaction data is showing us — and what it means for you as a seller:
Quality is getting rewarded more than ever. Premium businesses with recurring revenue and management teams still received competitive offers, while weaker profiles saw fewer offers and longer time-to-close. Buyers paid premiums for quality rather than lifting the whole market, and the gap between prepared and unprepared businesses widened.
In plain terms: if your business is well-prepared, the market is good. If it isn’t, you’re competing for a shrinking pool of buyers.
The lower middle market is outperforming Main Street. Deals in the $5M to $50M segment have moved from about 5.0x EBITDA in 2022 to 6.5x in Q3 2025 per the IBBA Market Pulse — the most pronounced expansion in the dataset. Small deals are flat. Larger quality deals are paying up.
This has a significant implication for business owners: if you’re close to crossing a size threshold — from $500K SDE to $1M SDE, for example — the value of getting there before you sell is dramatically larger than most owners realize.
PE consolidators are active in specific sectors. In home services (HVAC, pest control, plumbing), healthcare (dental, ophthalmology, med spas), and professional services (accounting, IT/MSP), private equity platform deals are creating competitive buyer dynamics that push multiples toward the top of industry ranges. If your business is in one of these sectors and is a potential bolt-on acquisition, you may have more leverage than a standard buyer-seller transaction would suggest.
How to Use This Data as a Business Owner
The right way to use these multiples is as a starting conversation, not an ending one.
Here’s our recommended process:
Step 1: Identify your correct metric. Are you an SDE business or an EBITDA business? If you’re unsure, use our Business Valuation Calculator — it will help you figure out which metric applies and give you a baseline estimate.
Step 2: Find your industry range. Use the tables above to identify the realistic range for your sector. Be honest — if your business has owner dependence, customer concentration, or messy financials, start at the low end of the range.
Step 3: Map your quality factors. Go through the six factors above and score yourself honestly. Are you recurring or project-based? Owner-dependent or systems-driven? Growing or flat? Each answer moves you up or down in the range.
Step 4: Calculate a realistic range. Apply your adjusted multiple to your normalized earnings. That’s your realistic valuation range — not a single number, but a defensible band you can take into conversations with brokers and buyers.
Step 5: Identify your biggest lever and pull it. If recurring revenue is low, that’s your highest-ROI improvement before going to market. If financials are messy, clean them up. If you’re operationally irreplaceable, start building systems and a management layer. These changes take time — which is why the best exits are planned 2–3 years in advance.
👉 Use our free Business Valuation Calculator to apply these multiples to your specific numbers and get a fast, data-driven estimate.
👉 Already know your baseline? Run our Margin Health Check to see how your margin profile compares to what buyers expect in your industry.
Frequently Asked Questions
What is the average EBITDA multiple for a small business in 2026?
For Main Street businesses (typically under $2M in enterprise value), the average SDE multiple was approximately 2.7x in early 2026. For lower middle market businesses ($2M–$50M), median EBITDA multiples ran around 4.8x–7.4x depending on industry and deal size, per IBBA and GF Data reporting.
Why do SaaS businesses sell at such high multiples?
SaaS businesses command high multiples because of the nature of their revenue. Subscription-based models with high net revenue retention (NRR) give buyers predictable, compounding cash flows that are far less risky than project-based revenue. Buyers are essentially paying for a revenue stream that renews itself — and that’s worth significantly more than a business where every dollar of next year’s revenue has to be re-earned.
What’s the difference between the high end and low end of an industry multiple range?
The spread within any industry’s range is driven by the same six factors in every sector: recurring revenue percentage, owner dependence, customer concentration, business size, financial documentation quality, and growth trajectory. Two businesses in the same industry with identical EBITDA can trade at a multiple that’s 50–100% different based entirely on these factors.
Do multiples change over time?
Yes. Multiples are influenced by interest rates, buyer demand, private equity activity, and broader economic conditions. Higher interest rates (which increase the cost of financing acquisitions) tend to compress multiples. Increased PE activity in a sector tends to expand them. The current market is bifurcated — premium businesses are getting strong multiples; underprepared businesses are sitting on the market longer.
How do I increase my business’s multiple?
Focus on the factors buyers reward: build recurring revenue, reduce owner dependency, diversify your customer base, document your processes, and keep your financials clean. These changes don’t happen overnight, but a 2–3 year improvement plan can move you from the bottom third to the top third of your industry’s range — which, depending on your earnings level, can mean hundreds of thousands or millions of dollars in additional sale proceeds.
The Bottom Line
The multiple your business commands isn’t determined by the industry table alone — it’s determined by how your business compares to the best and worst businesses in your industry and how prepared you are when a buyer sits across the table from you.
The industry range tells you what’s possible. Your preparation determines where inside that range you actually land.
That’s the whole game. And the time to start playing it is well before you decide to sell.
👉 Start with your baseline: use our free Business Valuation Calculator to see what your business is worth at current market multiples.
Related Reading
- What Is a Business Worth? The 4 Valuation Methods Explained
- The 7 Value Drivers That Push Your Multiple Above the Midpoint
- Why Your Asking Price and Your Business Value Are Two Different Numbers
- Owner Dependency: The Single Biggest Value Killer in Small Business Sales
- The EBITDA Add-Backs Buyers Accept vs. The Ones That Blow Up Deals
- Explore All Free PeachBiz Business Calculators