Wide-format flat-design illustration of a balanced scale with a stack of clean, organized financial documents and a green checkmark on the left tipping it heavier, and a large percentage symbol representing a valuation multiple on the right, with a rising bar chart in the background, in a warm peach-orange and dark navy palette.

Why Clean Books Are Worth More Than a Higher Multiple

Ask most business owners what they want to improve before selling, and they’ll tell you they want a higher multiple. It makes sense on the surface. If your business earns $400,000 in SDE and you can get a 3.5x multiple instead of a 3.0x, that’s $200,000 more in your pocket. Who wouldn’t want that? The […]


Wide-format flat-design illustration of a buyer at a desk with three financial document stacks labeled Year 1, Year 2, and Year 3, holding a magnifying glass over one document with green highlight marks on some sections and red question marks on others, in a warm peach-orange and dark navy palette.

3 Years of Financials: What Buyers Read, What They Ignore, and What Scares Them

When a qualified buyer sits down with your three years of financials, they are not reading them the way your accountant reads them. They are not reading them the way you read them. They are reading them like a detective. They’re not looking for what’s there. They’re looking for what’s missing, what doesn’t reconcile, what […]

Wide-format flat-design illustration of a Seller's Discretionary Earnings Statement on a desk with rows of unreadable financial line items, supporting tax returns, bank statements, and receipts stacked beside it, plus a calculator and pen, in a warm peach-orange and dark navy palette.

How to Build a Seller’s Discretionary Earnings (SDE) Statement That Holds Up Under Due Diligence

Your SDE statement is the most important financial document in your business sale. Not your tax return. Not your profit and loss statement. Not your balance sheet. Your SDE statement. It is the document that tells buyers, their lenders, and their advisors what your business actually earns — stripped of tax strategy, personal expenses, and […]

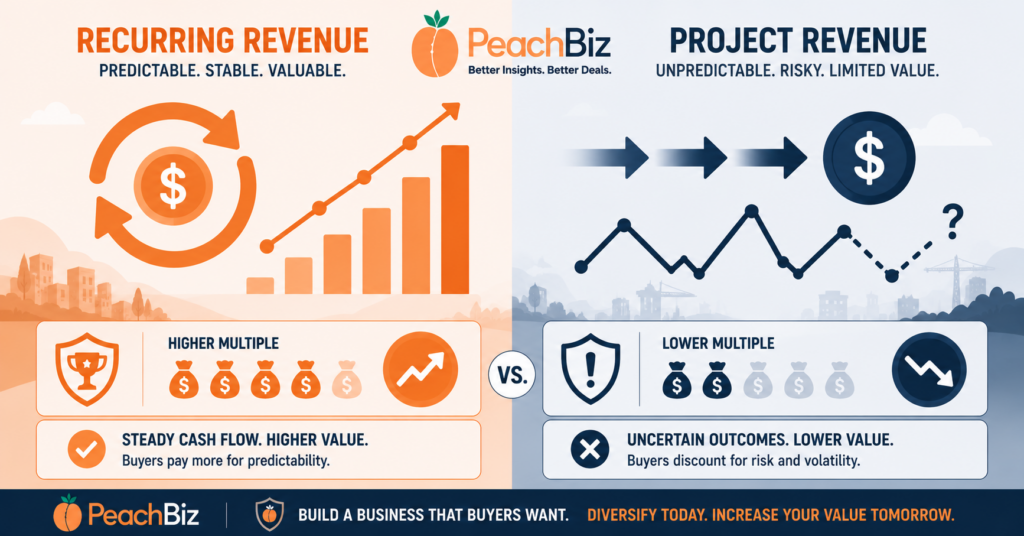
Wide-format flat-design illustration split into two halves — a recurring revenue side with circular repeat-payment arrows, a steady upward trend line, and a higher multiple indicator, and a project revenue side with one-directional arrows, a jagged uncertain revenue line, and a lower multiple indicator — in warm peach-orange for recurring and dark navy for project revenue.

Recurring Revenue vs. Project Revenue: How Buyer Perception Changes the Math

Two businesses. Same industry. Same revenue. Same EBITDA. Same owner. Same market. One sells for $2,400,000. The other sells for $1,600,000. What’s the difference? One has 60% recurring revenue. The other earns everything from one-time projects. That $800,000 gap — on identical earnings — is the recurring revenue premium. And it’s one of the most […]

Wide-format flat-design pie chart dominated by one large slice representing a top customer taking 40 to 50 percent of revenue, with smaller slices for other customers and a downward-pointing red arrow signaling declining valuation, in warm peach-orange for the dominant slice, dark navy for the others, and red for the warning arrow.

How Customer Concentration Tanks a Valuation (And How to Fix It Before You Sell)

You’ve spent years building a business. Revenue is strong. Margins are healthy. You’re ready to sell. Then your broker runs the customer analysis and finds it: one customer accounts for 38% of your revenue. Maybe two customers together account for 55%. Suddenly the conversation changes. The multiple you expected starts shrinking. Your broker starts talking […]

Wide-format flat-design illustration of a slightly overwhelmed business owner at the center of a hub-and-spoke diagram, with sales, operations, customer service, finance, and vendor relations all connecting only through them and no direct links between the functions, in a warm peach-orange and dark navy palette.

Owner Dependency: The Single Biggest Value Killer in Small Business Sales

Here is a question that most business owners have never honestly answered: If you disappeared from your business tomorrow — not gradually, not with a transition plan, but completely and immediately — what would happen? For most small business owners, the honest answer is uncomfortable. Revenue would drop because key customers buy from you personally. […]

Wide-format flat-design illustration of seven upward-pointing arrows of increasing height forming a staircase pattern, rising toward a multiple range indicator that moves from average multiple to premium multiple, in a warm peach-orange and dark navy palette.

The 7 Value Drivers That Push Your Multiple Above the Midpoint

Every industry has a multiple range. In home services, it might be 2.5x–5.0x SDE. In manufacturing, 4.0x–7.0x EBITDA. In professional services, 3.0x–6.0x. The range is set by the market — by what buyers in aggregate are willing to pay for businesses in that sector. Where your business lands inside that range is set by you. […]

Wide-format flat-design illustration of a seller figure at the center holding a Seller Financing Available document as a fulcrum, with multiple buyer figures approaching from different directions showing interest and a rising price arrow in the background, in a warm peach-orange and dark navy palette.

Seller Financing as a Value Lever: How It Can Increase Your Sale Price

Most business owners think of financing as the buyer’s problem. The buyer needs to figure out how to fund the acquisition — through savings, an SBA loan, private equity, or some combination. The seller’s job is to pick the best offer and close. Financing is a buyer concern, not a seller strategy. That’s exactly backwards […]

Wide-format flat-design illustration of a business seller holding a contract with a large question mark above a performance chart showing a target line with some bars reaching it in green and others falling short in red-orange, with a balance scale in the background showing risk shifting from buyer to seller, in a warm peach-orange and dark navy palette.

Earnouts: When They Make Sense and When They’re a Red Flag

Few deal structure components generate more seller anxiety — or more post-closing disputes — than the earnout. And for good reason. An earnout asks you to accept a fundamental bargain: we’ll pay you the full price you’re asking, but only if the business continues to perform at the level you’re claiming after you’ve handed it […]

Wide-format flat-design illustration of enterprise value splitting into four segments flowing to a seller figure — cash at closing as the largest green segment, seller note as a medium peach-orange segment, earnout as a smaller yellow segment, and equity rollover as the smallest navy segment — each with a different timing indicator.

How Deal Structure Affects the Real Price You Walk Away With

The number on the LOI is not what you walk away with. This is one of the most important — and most consistently misunderstood — realities of selling a business. Sellers spend months focused on achieving a target enterprise value: $2M, $5M, $10M. They negotiate hard to reach that number. They celebrate when the LOI […]

Let's get started

Give us a call or fill in the form below and we will contact you. We endeavor to answer all inquiries within 24 hours.