
3 Years of Financials: What Buyers Read, What They Ignore, and What Scares Them

When a qualified buyer sits down with your three years of financials, they are not reading them the way your accountant reads them. They are not reading them the way you read them.
They are reading them like a detective.
They’re not looking for what’s there. They’re looking for what’s missing, what doesn’t reconcile, what changed between years without explanation, and what the numbers reveal about the business that the seller didn’t volunteer.
Every experienced buyer has a story — a deal where the financials looked fine on the surface and something surfaced in due diligence that changed everything. Those stories make buyers careful. Methodical. Skeptical in exactly the right places.
Understanding how buyers actually read your financials — what they go to first, what they spend the most time on, what they flag, and what makes them pick up the phone to tell their advisor they’ve found something — is one of the most useful things you can know before you go to market.
This article gives you that perspective. We’re going to walk through the buyer’s financial review process from start to finish — the sequence, the focus areas, the patterns that reassure them, and the patterns that trigger concern. By the end, you’ll know exactly how to present your financials and exactly what you need to address before a buyer ever sees them.
How Buyers Approach Three Years of Financials
Before we get into the specifics, it helps to understand the buyer’s mindset going in.
A buyer reviewing your financials for the first time is simultaneously trying to answer three questions:
1. Is this business what the seller says it is? The financials are a verification exercise. The seller’s asking price and description imply a certain level of earnings, stability, and quality. The buyer is checking whether the numbers support that representation.
2. What risks am I taking on that aren’t visible in the asking price? Every business has risks. Buyers aren’t trying to find a perfect business — they don’t exist. They’re trying to identify risks that aren’t already priced in, because those are the ones that will cost them money after closing.
3. Can I finance this? For most buyers using SBA or conventional financing, their lender will independently verify the financials. Buyers know this, which means they’re also evaluating whether the financial presentation will survive lender underwriting — not just whether it tells a good story.
With that mindset established, here’s how the review actually unfolds.
What Buyers Read First: The Revenue Trend
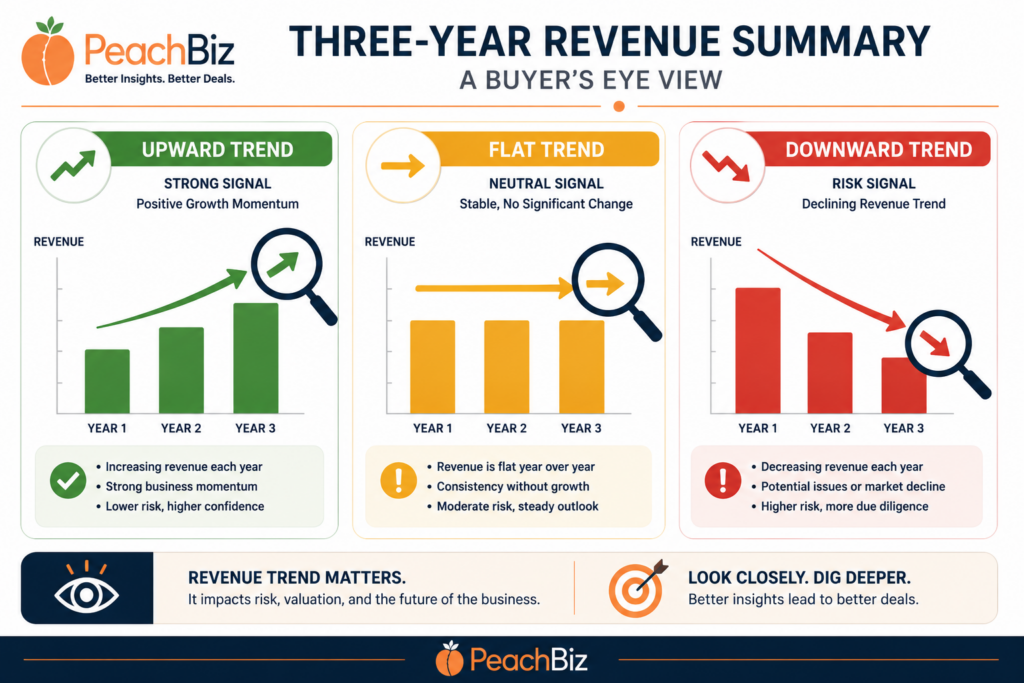
The first thing almost every experienced buyer looks at is not your current year earnings. It’s the trend across all three years.
The three-year view does something a single year can’t: it tells a story. And buyers are trying to understand that story before they engage with any individual number.
An upward trend — revenue growing consistently over three years — is the strongest possible opening statement your financials can make. It tells the buyer they’re looking at a business with momentum, that the current earnings are likely to continue or grow, and that the risk profile is lower than a flat or declining business. Upward-trending businesses attract more buyers, generate higher multiples, and close faster.
A flat trend — revenue stable within a narrow band over three years — tells buyers they’re looking at a steady, reliable income stream. This is not a negative for most buyers. A stable business with predictable cash flows is exactly what many individual buyers and some PE buyers are looking for. The story here is consistency, and consistency has real value.
A declining trend — revenue falling over two or more consecutive years — is the first and most significant buyer alarm. It doesn’t automatically end the conversation, but it immediately changes it. Every subsequent question has a subtext: is this decline structural or temporary? Is it market-wide or business-specific? Has the seller identified the cause and addressed it? Can I underwrite this business without excessive risk?
What sellers often miss: Buyers don’t just look at the total revenue numbers. They look at the growth rate between each year, not just the direction. A business that grew 25% in Year 1, 8% in Year 2, and 2% in Year 3 tells a different story than one that grew 10% each year — even if the three-year revenue numbers are similar. Decelerating growth is a yellow flag. Buyers will ask about it.
What to do before you go to market: Know your three-year revenue trend before a buyer sees it. If the trend is positive, make sure it’s clearly presented in your CIM. If it’s flat or declining, prepare a clear, documented narrative about why — and ideally evidence that the cause has been addressed.
What Buyers Spend the Most Time On: Margin Analysis
Revenue is the opening. Margins are where buyers do their real work.
Experienced buyers — and every buyer’s financial advisor — will build a margin analysis before they build anything else. They want to see:
Gross margin by year — Revenue minus cost of goods sold, expressed as a percentage. This tells them how efficiently the business converts revenue into gross profit before operating expenses.
EBITDA or SDE margin by year — Normalized earnings as a percentage of revenue. This is the bottom-line efficiency measure and the foundation of the valuation.
Expense category trends — How each major expense category has moved relative to revenue over three years. Is labor as a percentage of revenue growing? Is cost of goods sold compressing margins? Are operating expenses well-controlled or gradually creeping up?
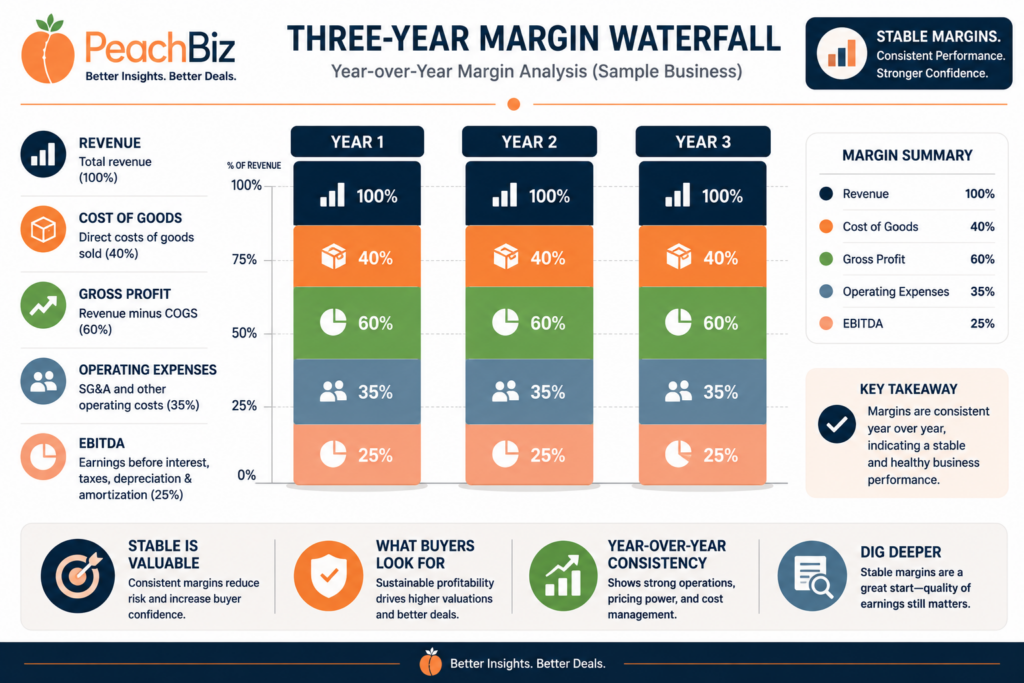
What healthy margins look like to a buyer:
Consistency is the primary signal. A business with 42% gross margins in Year 1, 41% in Year 2, and 43% in Year 3 tells a buyer that the cost structure is well-managed and predictable. A business with 42%, 31%, and 44% margins in consecutive years tells a very different story — even if the average is the same.
Buyers are also looking for the relationship between gross margin and SDE margin. If your gross margin is strong but your SDE margin is thin, they’ll want to understand where the operating expenses are going and whether those costs are controllable under new ownership.
What triggers concern:
- Gross margins compressing over three years (cost increases not passed to customers, or revenue mix shifting toward lower-margin products/services)
- Operating expenses growing faster than revenue (cost creep)
- A significant one-year margin spike followed by a return to lower levels (suggests an anomaly that inflates current-year earnings)
- SDE margin that’s unusually high relative to industry norms (buyers wonder what’s missing from the expense base)
What to do before you go to market: Calculate your three-year margin profile before your buyer does. Identify any unusual patterns and prepare explanations. If margins are compressing, understand why and be ready to address it — because it will be the first follow-up question after the initial financial review.
What Buyers Cross-Reference: The Tax Return vs. P&L Reconciliation
This is where many sellers are surprised by the depth of buyer scrutiny.
Experienced buyers — particularly those with financial backgrounds or working with experienced advisors — will pull your tax returns and compare them line by line to your profit and loss statements. They’re looking for:
Consistency between what you reported to the IRS and what you’re showing them. Significant differences between your tax return income and your P&L income require explanation. The explanations are often legitimate (timing differences, cash vs. accrual accounting, book vs. tax depreciation) but they need to be documented.
Revenue on the bank statements vs. revenue on the P&L. Buyers will request bank statements and compare monthly deposits to monthly P&L revenue. If your P&L shows $85,000 in October revenue but your bank statements show $40,000 in October deposits, they’ll want to know why. The answer might be timing (deposits cleared in November), payment processor timing, or accounts receivable — but unexplained discrepancies trigger deep concern.
Consistency of expense categories across years. If your meals and entertainment expense was $8,000 in Year 1, $11,000 in Year 2, and $47,000 in Year 3, buyers will ask about the Year 3 spike — and if it happened to be the same year they’re using for valuation, they’ll question whether it’s a legitimate expense or creative management of the earnings base.
What to do before you go to market: Reconcile your tax returns, P&Ls, and bank statements yourself before a buyer does. Identify every significant discrepancy and prepare a clear explanation. Present these reconciliations proactively in your financial package — a seller who explains the differences before being asked demonstrates financial sophistication and builds trust.
What Buyers Look For in the Balance Sheet
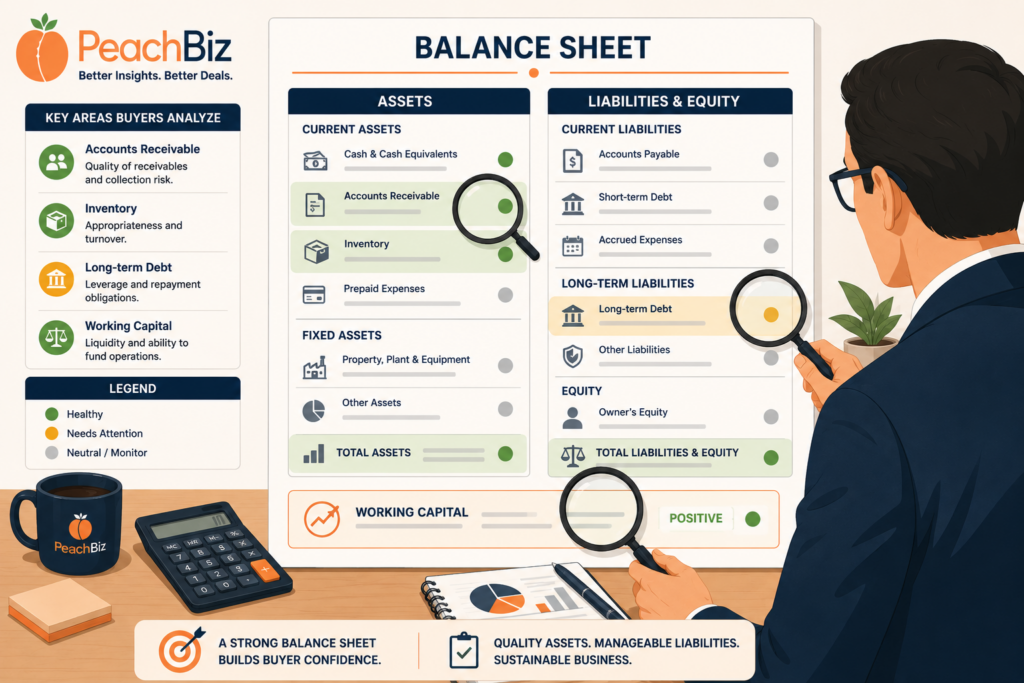
Most sellers think of the balance sheet as less important than the income statement in a business sale. Most experienced buyers think the opposite.
The balance sheet is where the real picture of the business’s financial health lives — and where the surprises that blow up deals after the LOI are most commonly found.
Accounts Receivable Aging
Buyers will request an AR aging report as part of their due diligence. They want to see:
- What percentage of receivables are current (under 30 days)
- What percentage are 30–60 days
- What percentage are 60–90 days
- What percentage are over 90 days
Receivables aging over 90 days that represent more than 15–20% of total AR signal collection problems. Buyers will either discount these receivables in their working capital analysis or demand they be collected before closing. An AR book that’s largely current signals a healthy business with good payment terms and active collections.
Inventory Quality
For product businesses, buyers will want to understand not just the inventory dollar amount on the balance sheet but the quality and condition of that inventory. Slow-moving inventory, obsolete inventory, or inventory that’s been on the books at cost for several years but is no longer sellable at that value is a balance sheet liability dressed up as an asset.
Buyers will often request an inventory aging analysis similar to AR aging — how much of the inventory is less than 90 days old, 90–180 days, over 180 days. Old inventory that hasn’t moved gets discounted heavily in their working capital analysis.
Debt Schedule
Every debt obligation on the balance sheet will be catalogued by buyers: amount outstanding, interest rate, monthly payment, maturity date, and collateral. This feeds directly into the enterprise-to-equity calculation and the working capital analysis. Buyers want to understand what they’re acquiring free and clear and what will be paid off at closing.
Off-Balance Sheet Obligations
Experienced buyers will ask specifically about obligations that might not appear on the balance sheet: operating leases (particularly under older accounting standards), contingent liabilities, personal guarantees by the owner, equipment that’s leased rather than owned. These are the items that can create post-closing surprises if they’re not disclosed upfront.
What Buyers Skim (But Will Return To If Something Feels Off)
Not everything in your financial package gets equal attention on the first pass. Some items that sellers spend significant time preparing get relatively little scrutiny in the initial review — but become important later if a buyer’s overall assessment raises questions.
Detailed expense line items below the major categories. Buyers initially review expenses at the category level — total labor, total COGS, total G&A. They don’t typically dig into individual line items within those categories on the first pass. They will if the category-level numbers don’t make sense or if something in due diligence prompts a deeper look.
Notes to financial statements. Most buyers skim these on first review. However, when a buyer’s advisor identifies a question or concern, the notes are often where they go to find the explanation — and if the explanation isn’t there, it becomes a due diligence request.
Historical depreciation schedules. Buyers will look at the current depreciation schedule to understand the age and condition of capital assets. The historical detail gets less attention initially but becomes important if the buyer is trying to understand upcoming capex requirements.
Accounts payable detail. AP aging gets less initial scrutiny than AR aging because it represents money going out rather than coming in. But if a buyer discovers that you’re behind on vendor payments — 90+ day payables to key suppliers — that’s a flag that surfaces during due diligence and affects the working capital analysis.
What Scares Buyers: The Patterns That Trigger Alarm
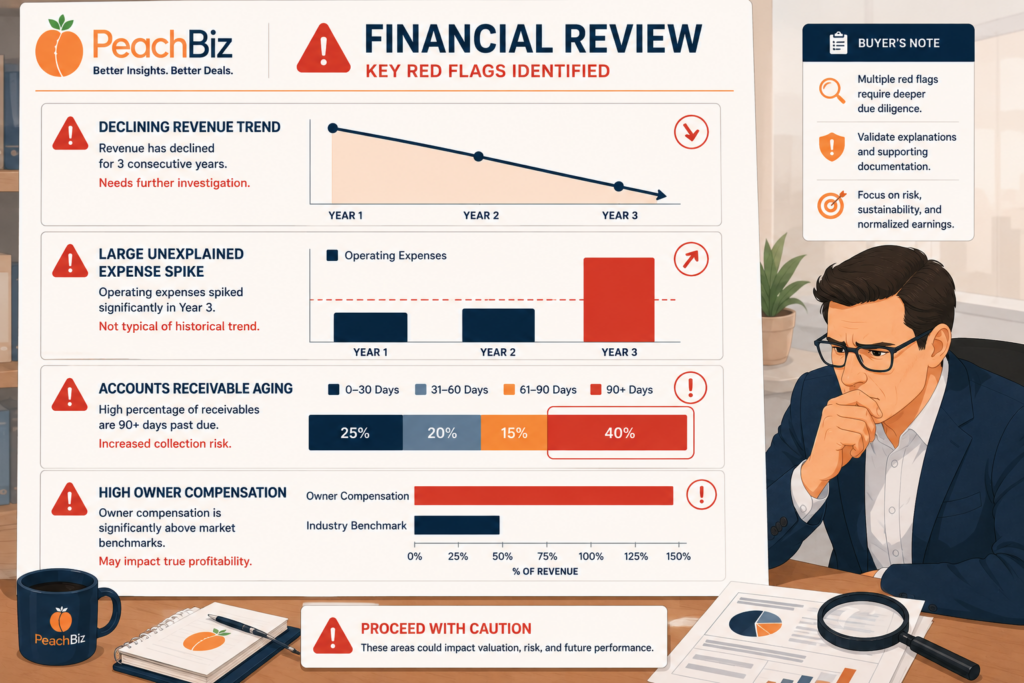
These are the specific patterns in three years of financials that cause experienced buyers to pause, flag for further investigation, or in some cases disengage entirely.
Unexplained revenue spikes or drops between years
A 30% revenue increase in Year 3 with no corresponding explanation in the CIM tells a buyer one of several things: a one-time event that won’t recur, a change in revenue recognition, or something the seller isn’t being upfront about. None of those interpretations are good for the seller. The same applies to unexplained drops.
The fix: document every significant year-over-year change. If Year 3 revenue jumped because you landed a major new client, say so in your CIM. If Year 2 was depressed because of a temporary operational issue, explain it. Control the narrative before buyers write their own.
Revenue that doesn’t match industry seasonality
If your business is in a seasonal industry — landscaping, retail, HVAC — buyers expect seasonal revenue patterns. Monthly financials that show unusually smooth revenue in a highly seasonal industry trigger questions about revenue recognition practices.
Large, unexplained increases in a specific expense category
A meals and entertainment expense that tripled in Year 3. A professional services expense that doubled with no explanation. A materials cost that increased dramatically faster than revenue. These patterns suggest either a genuine business change that needs explanation or financial management that buyers will scrutinize carefully.
Revenue that grows but margins that shrink
Revenue growth is good. Revenue growth with declining margins is a warning sign — it suggests the business is buying revenue through price concessions, higher costs, or a mix shift toward lower-margin work. Buyers will model whether this trend continues post-acquisition.
Owner compensation that changed significantly between years
An owner who paid themselves $80,000 in Year 1, $80,000 in Year 2, and $280,000 in Year 3 immediately raises questions. Was Year 3 compensation inflated ahead of the sale? Was the prior compensation below market because cash flow was constrained? Either scenario has implications for the SDE calculation and the deal structure.
Significant related-party transactions
Transactions between the business and entities or individuals related to the owner — rent paid to an owner-controlled LLC, consulting fees to a family member’s company, purchases from a supplier where the owner has an ownership interest — require careful documentation and disclosure. Undisclosed related-party transactions discovered in due diligence are one of the most common sources of deal renegotiation and one of the most damaging credibility hits a seller can take.
Loans to or from owners on the balance sheet
Owner loans to the business that appear as assets, or business loans to the owner that appear as liabilities, create complexity in the closing process. Buyers will want these resolved before or at closing — and the structure of that resolution has tax implications that need to be planned in advance.
How to Present Your Financials to a Buyer
Understanding how buyers read your financials is only useful if it changes how you present them. Here’s what a well-prepared financial package looks like from a buyer’s perspective:
The CIM financial summary should lead with the three-year revenue and SDE trend, clearly presented in a format that makes the story immediately visible. Don’t make buyers hunt for the trend — show it to them in the first financial page.
The SDE recast should be complete, three years side by side, with every add-back sourced and explained. See How to Build a Seller’s Discretionary Earnings (SDE) Statement That Holds Up Under Due Diligence for the complete guide.
The supporting financials — tax returns, monthly P&Ls, bank statements — should be organized, complete, and available on request. Don’t make buyers ask for basic documents — have them ready.
A narrative explanation of anomalies should be included in the CIM for every significant year-over-year change in revenue, margins, or major expense categories. This doesn’t need to be elaborate — a sentence or two per anomaly, clearly presented as part of the financial narrative.
Bank statements reconciled to P&L should be available to confirm that the revenue on the P&L corresponds to actual deposits. Buyers will ask for this in due diligence. Having it ready before they ask shortens the process and signals preparedness.
👉 Use our free Business Valuation Calculator to understand how buyers will interpret your three-year financial trend and what it means for your valuation range.
👉 Run our Margin Health Check to see how your margin profile compares to industry benchmarks — the same comparison a buyer’s advisor will make when they review your financials.
Frequently Asked Questions
Do buyers always look at three years of financials?
Three years is the standard — for SBA loans it’s a requirement, and most experienced buyers won’t seriously consider a business without at least two to three years of financial history. Businesses with less than two years of operating history face a much smaller buyer pool and typically need to demonstrate unusually strong current performance to attract serious interest.
What if one of my three years was significantly affected by COVID?
COVID-affected years (typically 2020 and to some extent 2021) are handled differently by most buyers and lenders today. For SBA loans, lenders may use 2019 and 2022–2023 performance as the baseline and treat 2020–2021 as anomalies. For buyer valuation, most sophisticated buyers will normalize COVID-affected years and place more weight on more recent performance. If your 2020–2021 results were significantly below or above normal, prepare a clear explanation with supporting documentation.
Can I share financials without a signed NDA?
No — and your broker should be managing this. Detailed financial information should only be shared with buyers who have signed a non-disclosure agreement and been pre-qualified by your broker. High-level information (revenue range, general industry, asking price range) can be shared in a blind profile before NDA, but tax returns, P&Ls, and bank statements should never be shared without a signed NDA in place.
What if my financials are on a cash basis rather than accrual?
Most small business financial statements are prepared on a cash basis, which is fine and expected by buyers. The important thing is consistency — cash basis financials for all three years. If you’ve switched accounting methods during the three-year period, that needs to be disclosed and the implications explained.
What do buyers do if they find something concerning in the financials?
The response depends on what they find and how significant it is. Minor concerns typically become due diligence requests — the buyer asks for additional documentation or explanation. Significant concerns become negotiating points — the buyer adjusts their offer, their deal structure, or requests a price reduction. Serious concerns that suggest material misrepresentation or undisclosed risk may cause the buyer to withdraw entirely. The key variable is whether the concern was disclosed upfront by the seller or discovered by the buyer — disclosed issues are managed; undisclosed ones are deal-killers.
The Bottom Line
Buyers read your financials like detectives because they’ve been burned before — by sellers who presented rosy numbers that didn’t hold up, by due diligence surprises that renegotiated deals or killed them, by businesses that were worth significantly less than their asking price once the full financial picture emerged.
The antidote is transparency and preparation. Know your three-year story before a buyer sees it. Explain the anomalies before they ask. Reconcile the discrepancies before they find them. Present the complete picture — including the parts that aren’t perfect — in a way that demonstrates financial sophistication and honesty.
Buyers who trust your financials move faster, offer more, and close cleaner than buyers who don’t. Trust is built in the financial package before the first meeting — and it starts with knowing exactly what buyers are looking for when they sit down with your numbers.
👉 Get your baseline valuation and understand how buyers will interpret your financial profile with our free Business Valuation Calculator.
Related Reading
- The EBITDA Add-Backs Buyers Accept vs. The Ones That Blow Up Deals
- How to Build a Seller’s Discretionary Earnings (SDE) Statement That Holds Up Under Due Diligence
- Why Clean Books Are Worth More Than a Higher Multiple
- Red Flags That Kill Deals Before the LOI: A Pre-Sale Checklist
- The 10 Factors Buyers Score Before They Make an Offer
- Why Your Asking Price and Your Business Value Are Two Different Numbers
- Explore All Free PeachBiz Business Calculators